Five Smart KPIs for Optimal Inventory Management
Inventory management can be perceived as a big part of logistics operations for distributor companies. Decisions made in terms of stock levels, storage area, and order quantity have a significant impact not only on inventory costs and risk of being out of stock (OOS), but also on timely replenishment operations, shelf availability and even relationships with customers.
In essence, managing inventory leads us to achieve three important aims in organizations. First is to provide a smooth flow of materials through the entire supply chain, with having a broad view from vendor to the warehouse and from warehouse to customers. Second rather adopts organizational view and is to underpin both logistics and warehouse operations for least cost and most efficient distribution and storage works. Finally yet importantly is functional with ensuring freshness and availability of products by taking into account the risk of obsolescence in the warehouse.
Most of the senior managers spend extensive time and effort through the review of elongated and detailed reports for making decisions accordingly.
To cover broad, organizational, and functional aims of inventory management and to make rapid decisions in today’s fast-acting environment, we need smart, time-saving, easy to interpret and most importantly decision-supporting key performance indicators (KPIs). In this regard, I would recommend five smart KPIs for optimal inventory management.
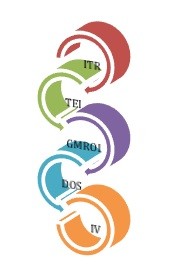
- Inventory Turnover Ratio (ITR):ITR helps us to measure the number of times we sell or turn our average inventory kept in the warehouse. In other words, it measures the number of opportunities to earn profit that we experience each year from our working capital invested in the inventory. It is calculated by dividing Cost of Goods (COGs) sold by the average inventory investment.
ITR: COGs / [(Opening Stock+Closing Stock)/2]
Benchmark: There is no specific benchmark for ITR. However, organizations who are product leaders in the market are likely to satisfy with ITR of 3-4 while operational excellence oriented organizations, such as low-cost airlines or wholesalers aim at achieving 8-9 ITR. On the other hand, distributors that handle a wide range of brands and strive to meet customer needs aim at keeping ITR around 5-7. Deciding the number of ITR is heavily related to the gross margin generated by related SKUs or brands. Thus, managers should also refer to the following KPI.
- Turn-Earn Index (TEI):TEI helps us to combine the gross margin and turnover. A logic behind TEI is to keep high ITR for SKUs or brands generating low margins and to satisfy with medium- or low-level ITR for SKUs or brands generating high margins.
TEI: (ITR) x (Gross Profit %) x 100
Benchmark: Achieving TEI between 150 and 180 is the best practice in terms of balancing gross margin and inventory. For instance, having 160 TEI for a brand can be interpreted as having 20% margin and turning inventory 8 times or having 40% margin with turning inventory 4 times per year.
- Gross Margin Return on Investment (GMROI):GMROI represents the amount of gross profit earned for every AED (or $, £, €, ₺) of the average investment made in inventory. It is calculated by dividing gross profit by the average inventory investment. Tracking GMROI on a monthly basis provides a significant clue in terms of having a clear understanding of which SKU or brand produce more gross profit in the inventory.
GMROI: [Gross Profit] / [(Opening Stock+Closing Stock) / 2] X 100
Benchmark: Achieving GMROI between 200 and 225 is the best practice by means of generating gross profit from the inventory hold for the related SKUs or brands.
- Days of Supply (DOS):DOS is the most common KPI used by managers in measuring the efficiency in supply chain. It is calculated by dividing the average inventory on hand (as value) by the average monthly demand (as value) and then multiplying it by thirty, when measuring on a monthly basis.
DOS: Average Inventory / Monthly Demand x 30
Benchmark: There is no specific target for DOS, but measuring it by considering the following months’ sales forecasts (as value) will help us to have a clear understanding of at which level we need to keep our stock to be able to improve inventory management on a monthly basis. Nevertheless, DOS does not help us to understand how well our inventory will match the demand. To cover this, we need the following KPI.
- Inventory Velocity (IV):IV is the percentage of inventory we are projecting to be consumed within the next period. It helps the managers to understand how well the inventory on hand matched the demand. It is calculated by dividing sales forecast of the following period by the opening stock. Tracking IV on a monthly basis will provide significant clues in terms of aligning inventory level to the optimal level for matching supply-demand, and preventing excessive stock in the warehouse.
IV: Next Month’s Sales Forecast / Opening Stock
Benchmark: For continuous SKUs, keeping IV between 60-70% will provide a good match of demand while 75-80% of IV can be more beneficial for fast-moving SKUs. Whilst having IV less than 60% indicates excessive stock, IV over 80% is risky in terms of being out of stock as it calls for Kanban-Pull system.
Practically, not all SKUs or brands can be treated equally via aforementioned KPIs. Applying Pareto Principle will help easily categorize SKUs (e.g. fast-, continuous-, intermittent- and slow-moving SKUs). Categorization can be based on monthly sales volume, margin percentage or the number of exits from the warehouse. Making use of Pareto Principle upon these three perspectives and then taking the average weights will be a good asset in terms of placing each SKU to the correct category.